
Over the past year we’ve been tracking and analysing Controller Decisions issued by the Indian Patent Office, publishing a monthly pictographic summary for April, May, June, July and August 2025 (September was skipped).
With the full Indian financial year – April 2025 through March 2026 – now complete, this post pulls all twelve months together into a single annual view.
This is 21,030 Controller Decisions analysed across the year, drawn from ipindia.gov.in’s published decisions data, cleaned and categorised using the same standardised methodology across every month (so the annual figures below are directly comparable across the year, even where a few numbers differ slightly from what was originally published in the individual monthly posts for April-September).
Rather than repeat all the monthly charts here, this post focuses on headline, year-level charts. For the granular month-by-month detail – jurisdiction breakdowns, top applicants by city, daily filing trends, and more – each month’s full chart set is available as a downloadable PDF at the end of this post.
FY 2025-26 at a Glance
- Total decisions analysed: 21,030
- Unique applicants: 8,932
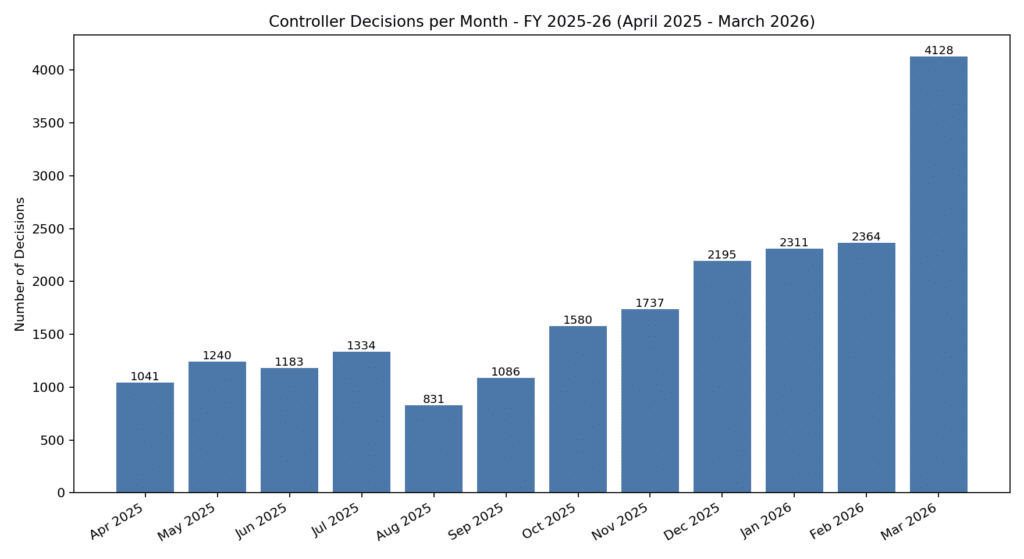
- Busiest month: March 2026 (4,128 decisions)
- Quietest month: August 2025 (831 decisions)
- First half (Apr-Sep 2025): 6,715 decisions
- Second half (Oct 2025-Mar 2026): 14,315 decisions
Key Stats
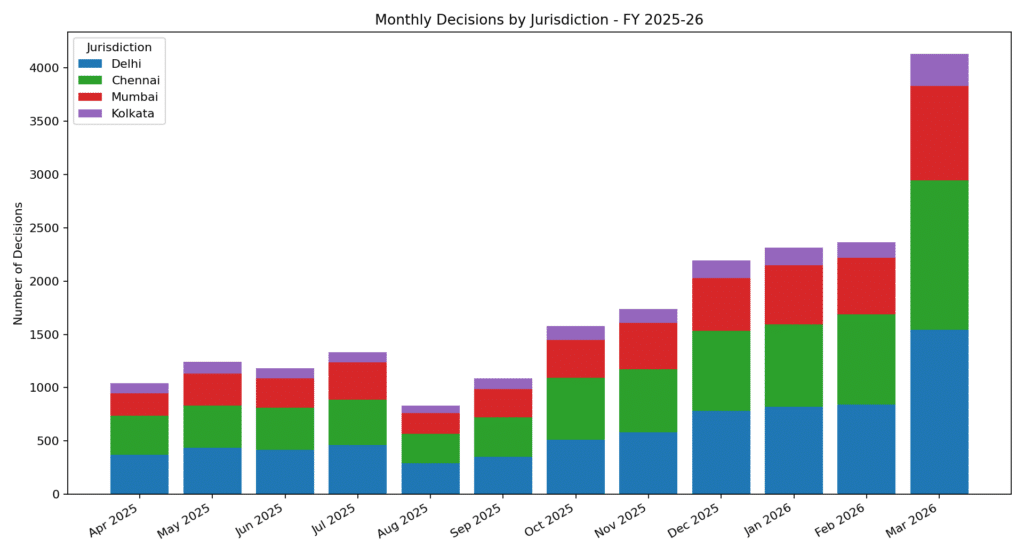
- Controller Decisions per Month – FY 2025-26: Monthly decision volume more than doubled over the course of the year, climbing from roughly 1,000-1,300 a month in the first quarter to over 4,100 in March 2026 alone.
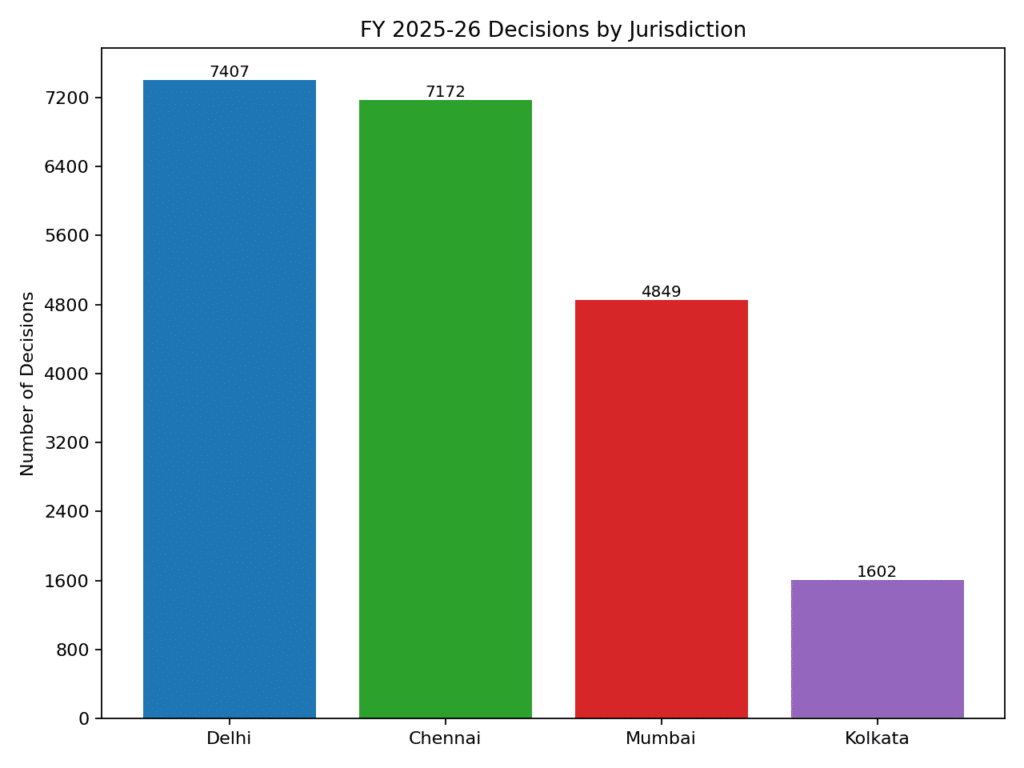
- Decisions by Jurisdiction – FY 2025-26: Delhi (35.2%) and Chennai (34.1%) together account for around seven in ten decisions for the year, with Mumbai at 23.1% and Kolkata at 7.6%.
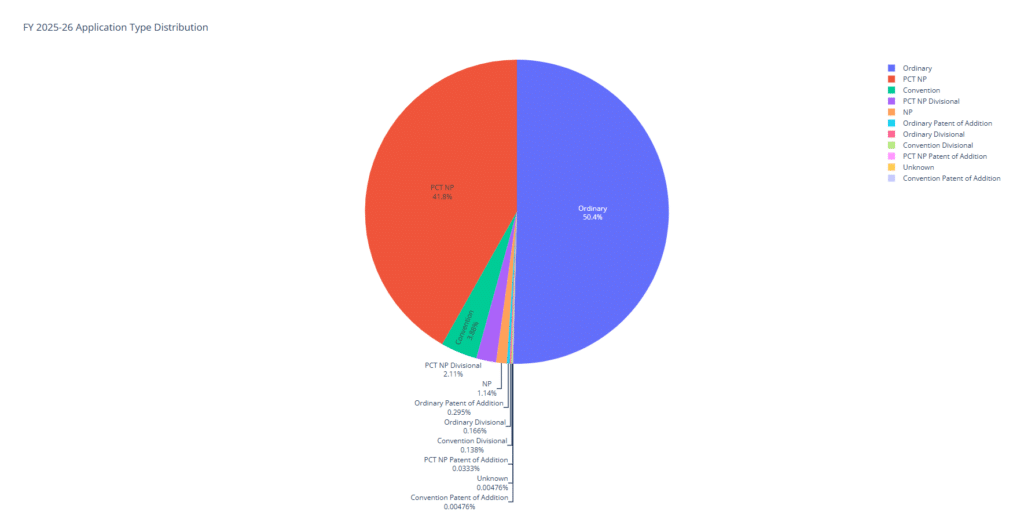
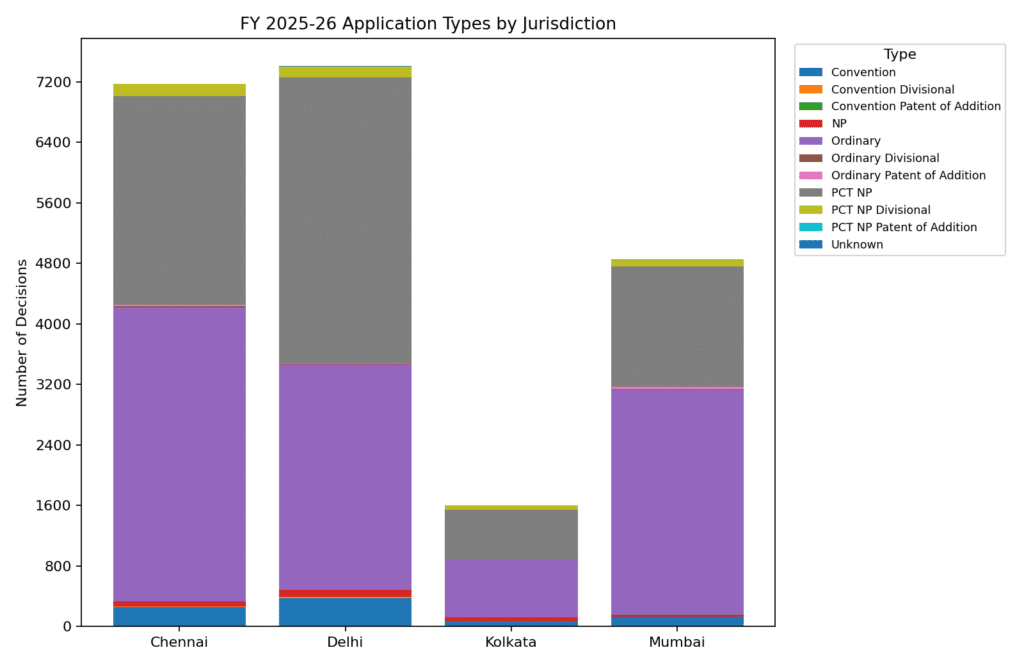
- Application Type Distribution – FY 2025-26: Ordinary applications (50.4%) and PCT National Phase applications (41.8%) dominate, together accounting for over 92% of all decisions.
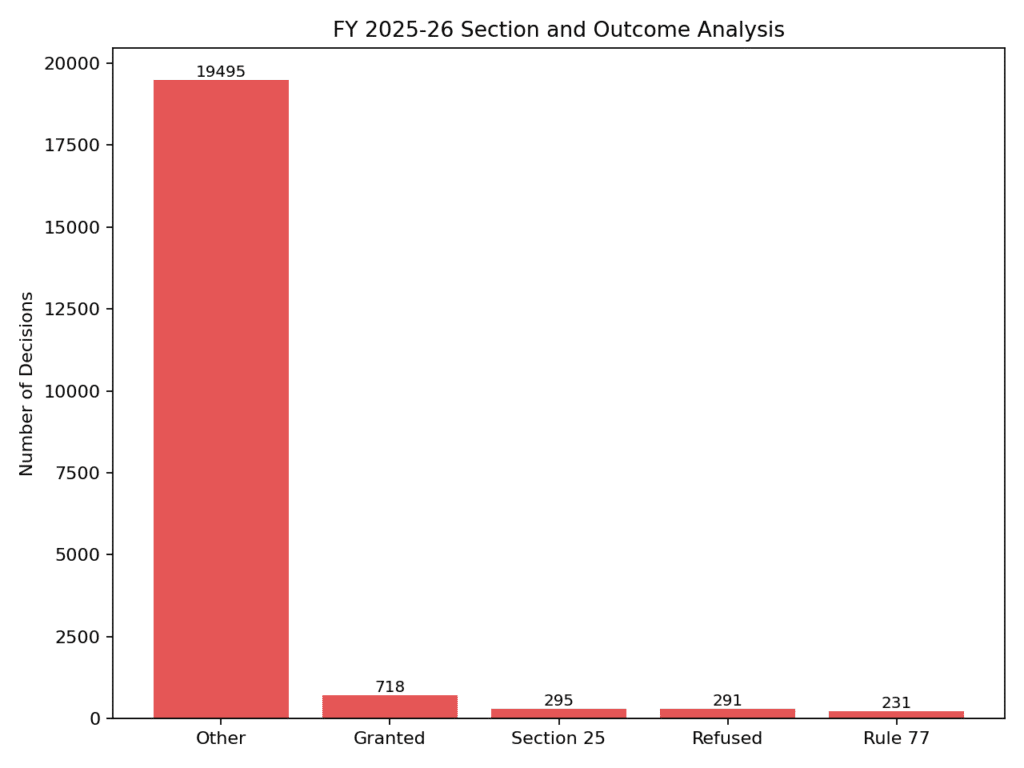
- Section and Outcome Analysis – FY 2025-26: Where an explicit outcome was stated in the decision text: 718 Grants, 295 under Section 25, 291 Refusals, and 231 under Rule 77. The large majority of decisions (92.7%) did not carry one of these explicit markers in the extracted text and fall under “Other.”
- Monthly Decisions by Jurisdiction – FY 2025-26: All four jurisdictions grew over the year, but the growth is not even – Delhi and Chennai’s share of the increase is visibly larger than Mumbai and Kolkata’s, especially from December 2025 onward.
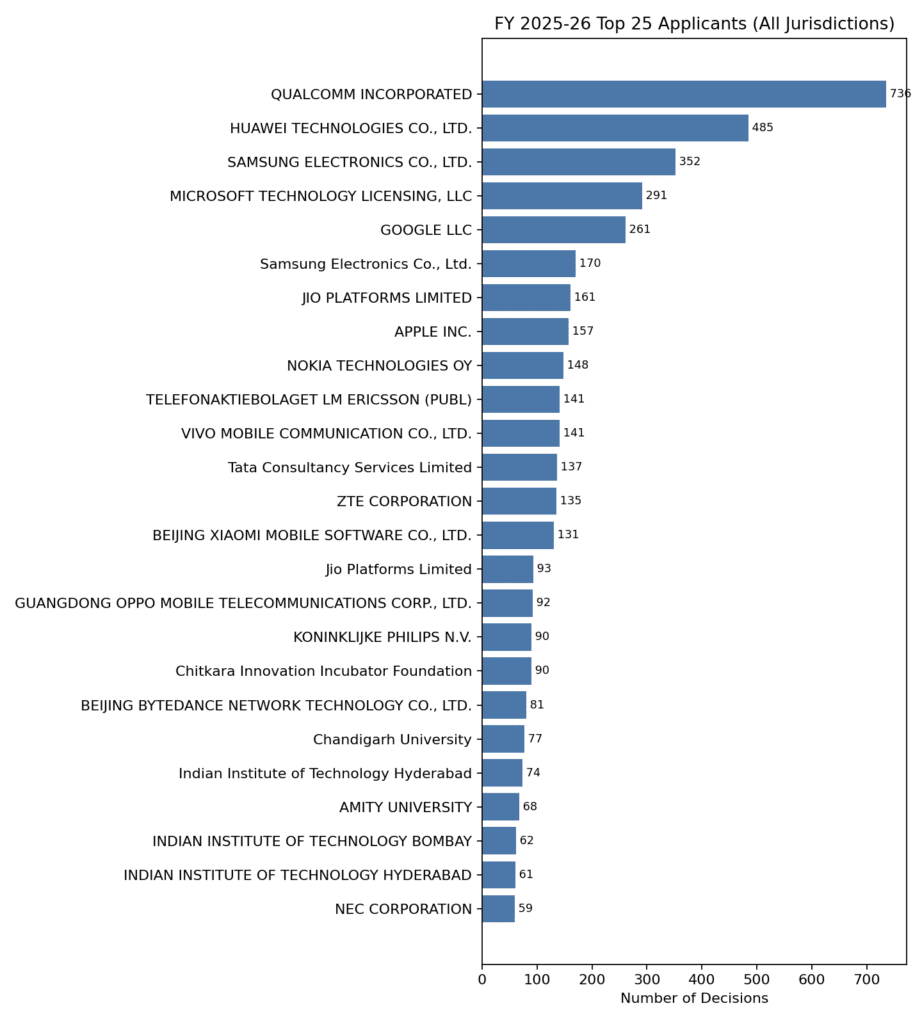
- Top 25 Applicants – FY 2025-26 (All Jurisdictions): Qualcomm Incorporated leads the year with 736 decisions, followed by Huawei Technologies (485), Samsung Electronics (352 + 170 under a second name-variant entry), Microsoft Technology Licensing (291), and Google LLC (261).
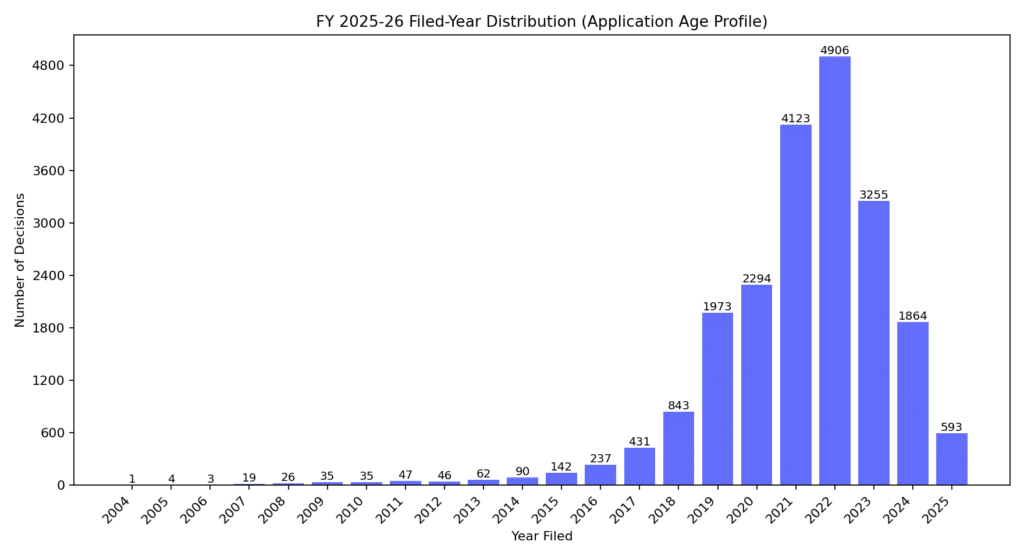
- Filed-Year Distribution – FY 2025-26: The bulk of this year’s decisions relate to applications filed in 2021-2023 (a combined 12,284 decisions, ~58% of the year’s total), reflecting the Patent Office’s typical examination-to-decision lag.
- Application Types by Jurisdiction – FY 2025-26: The Ordinary/PCT NP mix varies by jurisdiction – worth a look if you’re tracking filing strategy by office.
Overall Analysis
Volume grew sharply through the year. From ~1,000-1,300 decisions a month in Q1 (Apr-Jun 2025) to over 4,100 in March 2026 – the second half of the financial year (14,315 decisions) accounts for roughly two-thirds of the year’s total output, more than double the first half (6,715).
Jurisdiction split stayed broadly stable. Delhi and Chennai have consistently been the two busiest offices all year, together handling roughly seven of every ten decisions; Kolkata remains the smallest by volume throughout.
Application type mix is dominated by two categories. Ordinary and PCT National Phase applications together make up over 92% of all decisions for the year, with Convention applications a distant third (3.9%).
Explicit outcome markers are the exception, not the rule. Only about 7.3% of decisions carry an explicit “Granted,” “Refused,” Section 25, or Rule 77 marker in the extracted text; the rest are decisions on other grounds (examination reports, hearing notices, miscellaneous orders, etc.) that don’t reduce to one of those categories from the text alone.
A small number of large filers account for a disproportionate share of decisions. Qualcomm, Huawei, Samsung, Jio Platforms, Microsoft and Google alone account for over 2,100 of the year’s 21,030 decisions (~10%) – consistent with what high-volume patent filers in the telecom/electronics space would be expected to generate.
Most decisions concern applications filed 2-4 years earlier. The 2021-2023 filing cohort dominates this year’s decisions, consistent with typical First Examination Report and prosecution timelines at the Indian Patent Office.
Methodology note. All twelve months were processed through the same standardised pipeline: duplicate decisions are removed within each month (not across the whole year, so a case legitimately re-decided in a later month – after a recall or rectification, for instance – is correctly counted in both months); Application Numbers are parsed for jurisdiction, filing year and application type covering both current and legacy numbering formats; and outcome categories (Granted/Refused/Section 25/Rule 77/Other) are derived consistently across all twelve months.
Download the Full Monthly Charts (PDF)
Each month’s complete chart set – jurisdiction breakdowns, daily decision timelines, top 25 applicants overall and by jurisdiction, application-type and outcome analysis, filed-year distribution – is available below as a downloadable PDF from the link (#).
– [April 2025 (1,041 decisions) – Download PDF](#)
– [May 2025 (1,240 decisions) – Download PDF](#)
– [June 2025 (1,183 decisions) – Download PDF](#)
– [July 2025 (1,334 decisions) – Download PDF](#)
– [August 2025 (831 decisions) – Download PDF](#)
– [September 2025 (1,086 decisions) – Download PDF](#)
– [October 2025 (1,580 decisions) – Download PDF](#)
– [November 2025 (1,737 decisions) – Download PDF](#)
– [December 2025 (2,195 decisions) – Download PDF](#)
– [January 2026 (2,311 decisions) – Download PDF](#)
– [February 2026 (2,364 decisions) – Download PDF](#)
– [March 2026 (4,128 decisions) – Download PDF](#)