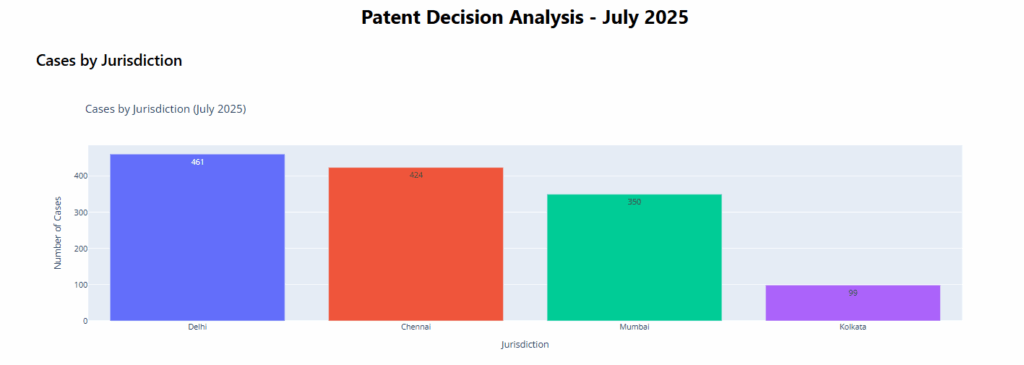
Applications sorted according to jurisdiction: As shown in the chart (above) itself, this is a histogram of the total number of application examined in each jurisdiction during the month of July 2025. A total of 1335 application data was obtained from the IP India website. Thereafter, duplicates were discarded and data analysed.
Total Applications by Jurisdiction: Jurisdiction
Delhi 461
Chennai 424
Mumbai 350
Kolkata 99
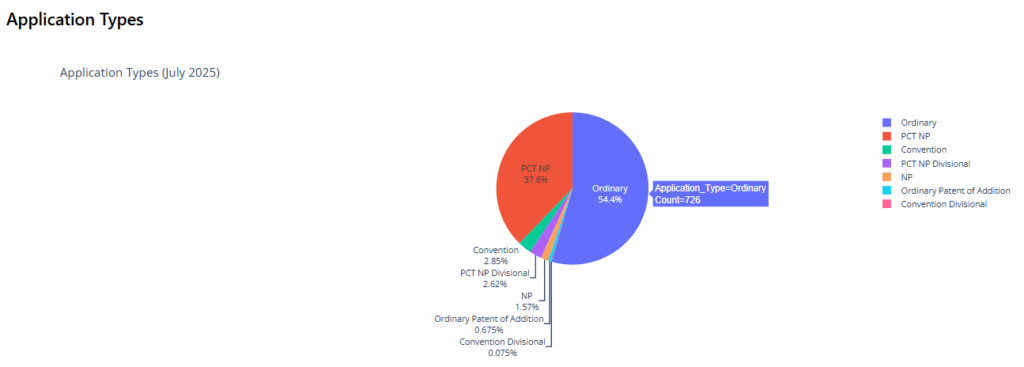
The above pie chart shows similar position to what was last month.
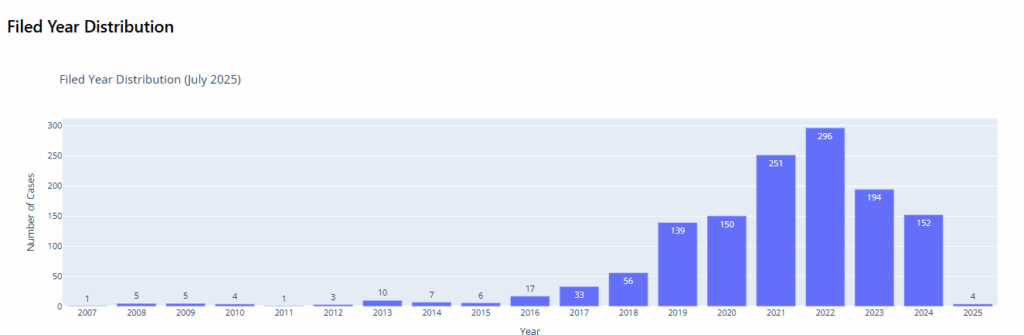
As can be seen bulk of the applications are from 3 years ago, i.e. 2022. This gives an indication that on average our patent office takes up applications that were filed about 36 months ago (+/- 6 months)
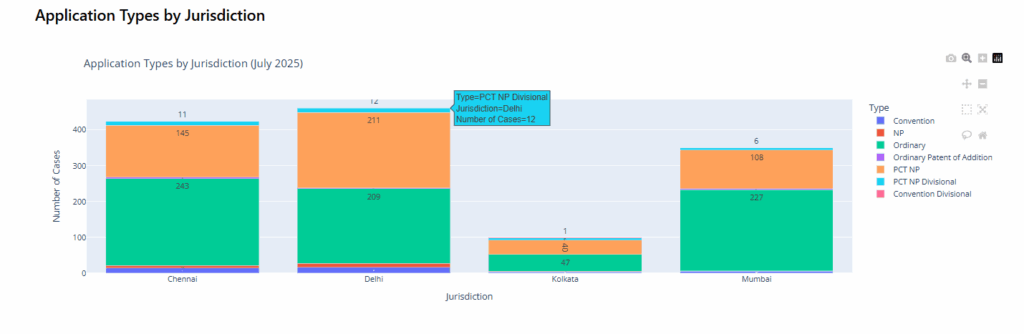
The above historgram / bar chart shows the specific number of PCT / Ordinary / NP Divisional, etc. applications that were examined at each of the patent offices.
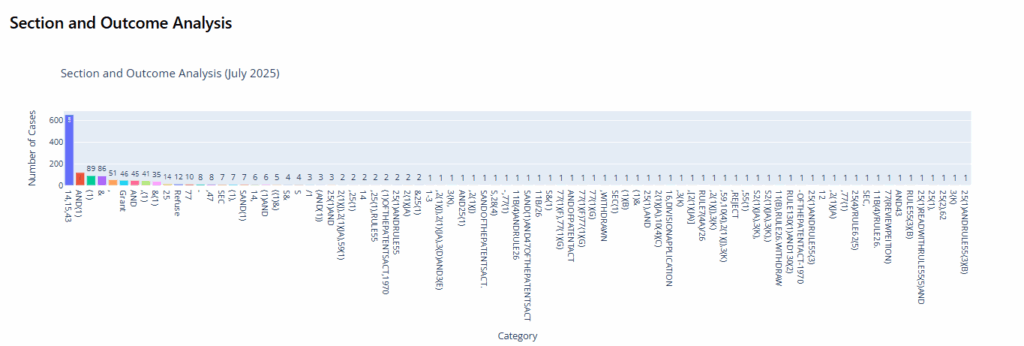
This time I wanted to have have better clarity over the outcomes, and hence I ended up cleaning / sorting / categorizing the data. THe chart above shows a somewhat uncategorized (somewhat because there is some level of cleaning that was done using python). The charts below take this chart and show better sorting of the final outcomes.
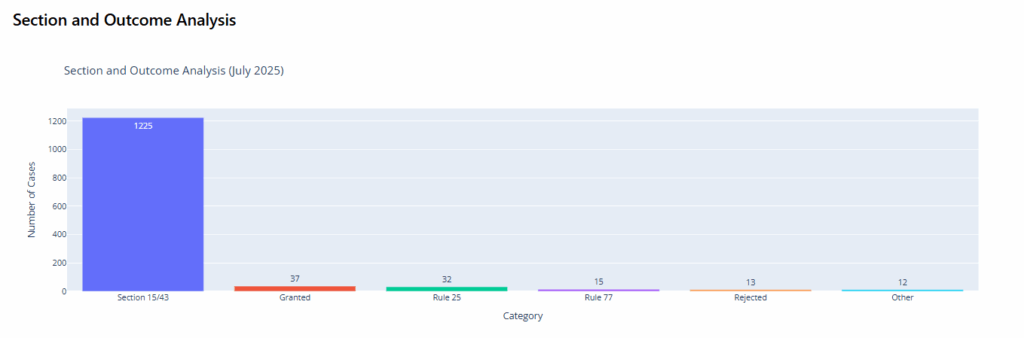
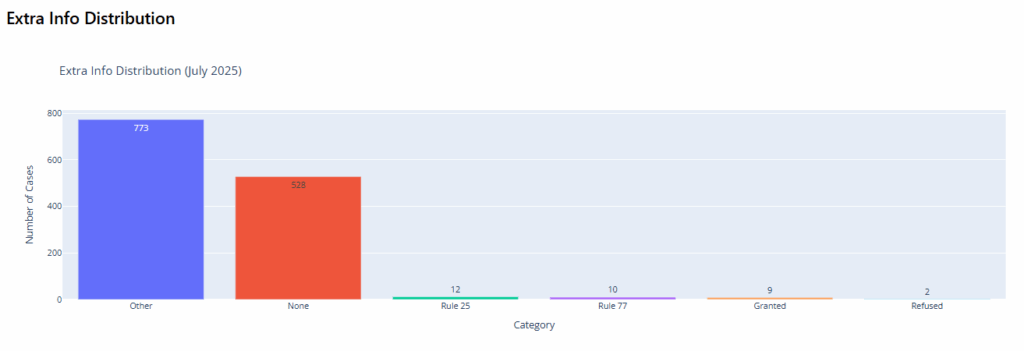
For the above three charts, the data was taken and then sorted and categorized twice: with basic refusal / grant data, coming in the second chart, and Extra Info – coming in the third chart.
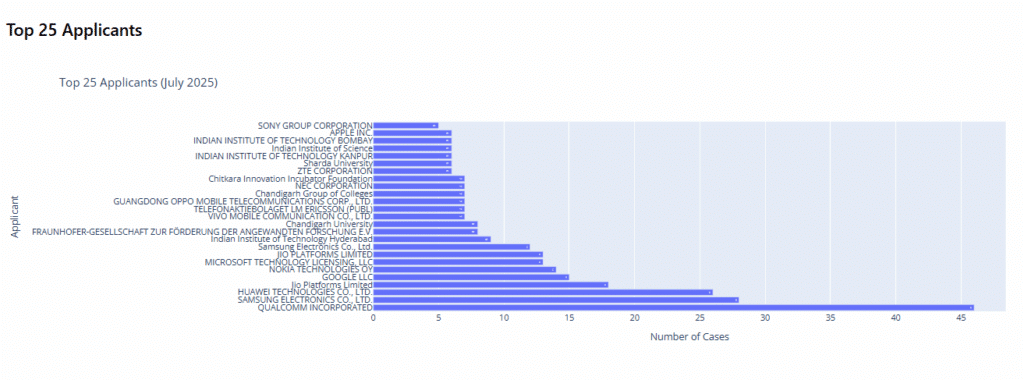
The Top 25 applicants whose decisions were issued in July 2025 are given below. In this, there is some level of cleaning required to be done as the same entry when done in CAPS and regular font is counted differently. Eg. Jio & JIO are shown as two different entities, whereas they should be counted as one.