
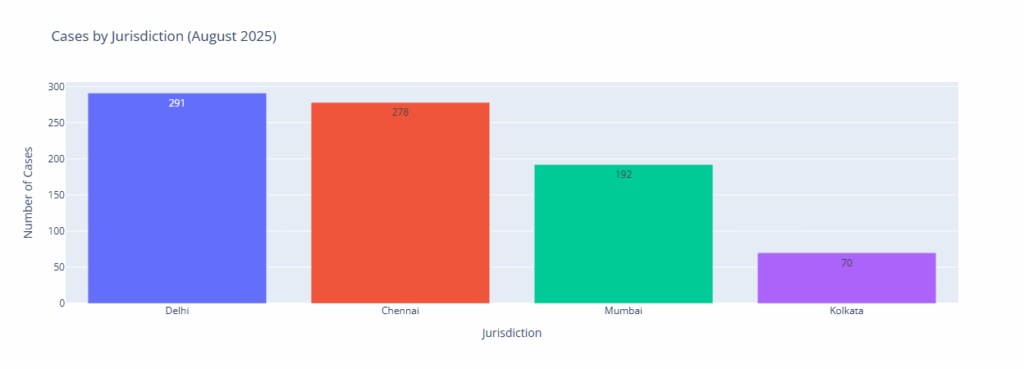
Applications sorted according to jurisdiction: As shown in the chart (above) itself, this is a histogram of the total number of application examined in each jurisdiction during the month of August 2025. A total of ~1100 application data was obtained from the IP India website. Thereafter, duplicates were discarded and data analysed.
Total Applications by Jurisdiction: Jurisdiction
Delhi 291
Chennai 278
Mumbai 192
Kolkata 70
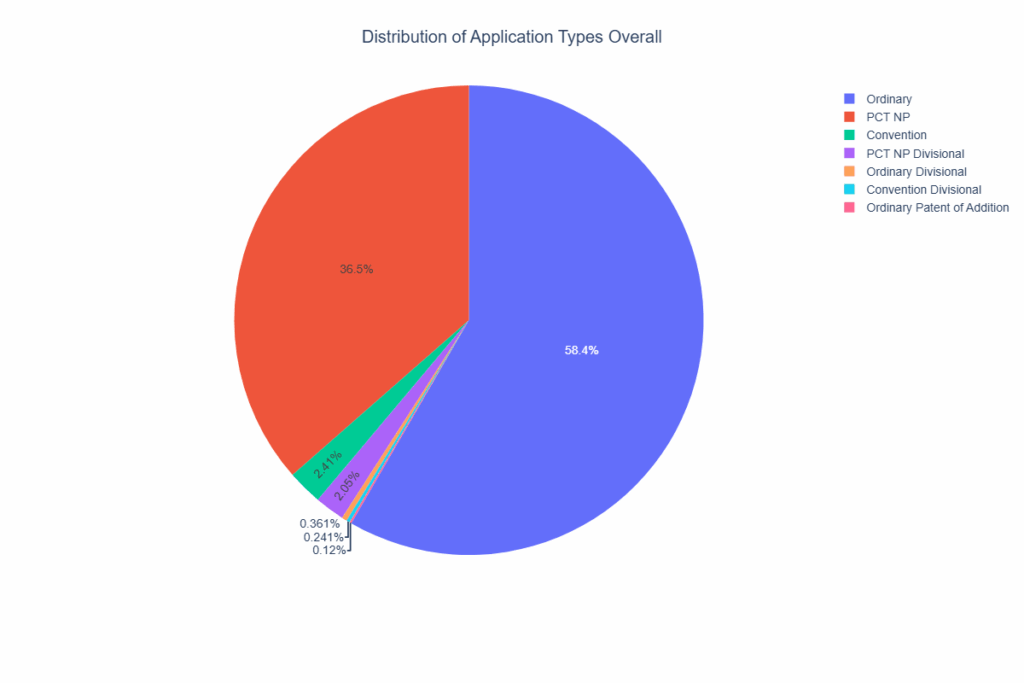
The data makes it clear that usually the Ordinary applications make up about 50% of the applications. About 40% is the PCT National Phase and rest about 10%.
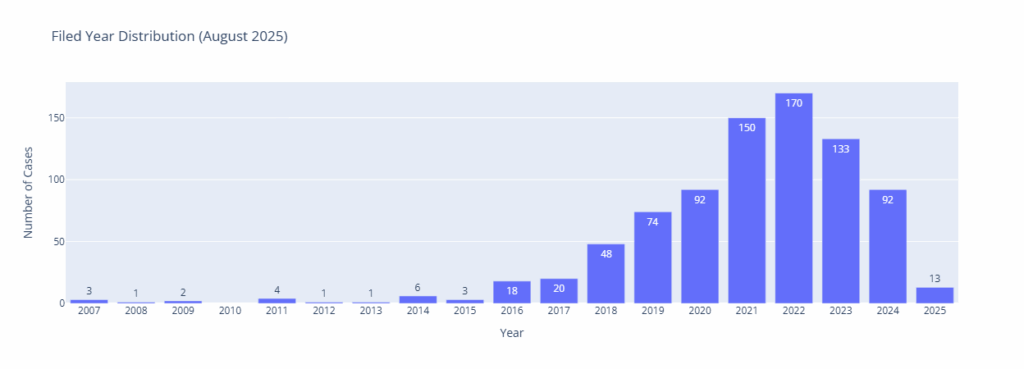
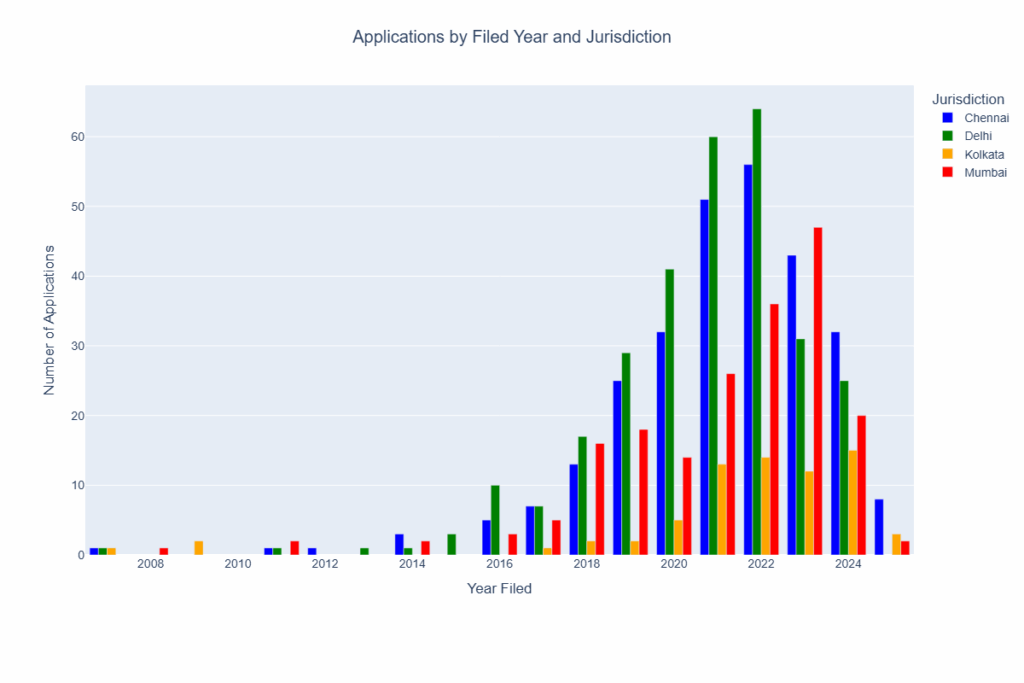
As can be seen bulk of the applications are from 3 years ago, i.e. 2022. This gives an indication that on average our patent office takes up applications that were filed about 36 months ago (+/- 6 months). I wanted to see this according to jurisdiction and ended up verifying that the maximum applications that were taken up for examination were filed in New Delhi patent office.
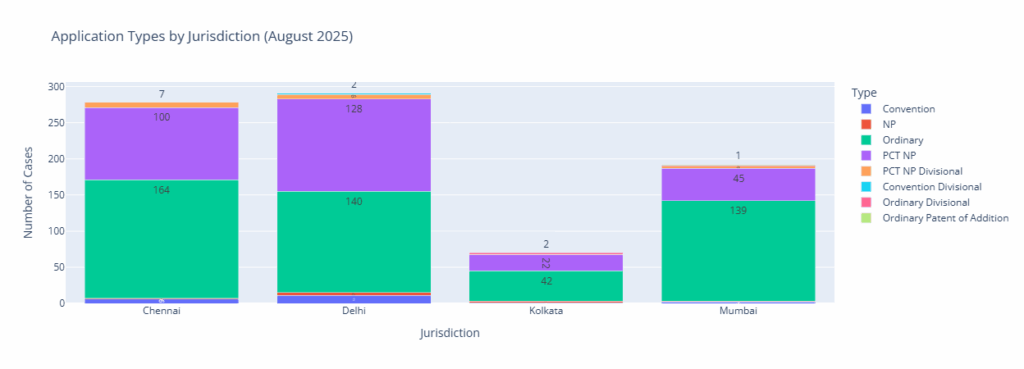
The above historgram / bar chart shows the specific number of PCT / Ordinary / NP Divisional, etc. applications that were examined at each of the patent offices.
Overall analysis – From this time onwards, the python output when running the analysis as also the data on which the analysis was done are provided. The data file can be downloaded by clicking here.
=== Patent / Controller Decision Analysis – August 2025 ===
Total Cases Analyzed: 831
1. Total Cases by Jurisdiction:
Delhi: 291 cases (35.0%) | Chennai: 278 cases (33.5%) | Mumbai: 192 cases (23.1%) | Kolkata: 70 cases (8.4%)
2. Application Type Distribution:
Ordinary: 485 cases (58.4%) | PCT NP: 295 cases (35.5%) | Convention: 20 cases (2.4%) | PCT NP Divisional: 17 cases (2.0%) | NP: 8 cases (1.0%) | Ordinary Divisional: 3 cases (0.4%) | Convention Divisional: 2 cases (0.2%) | Ordinary Patent of Addition: 1 cases (0.1%)
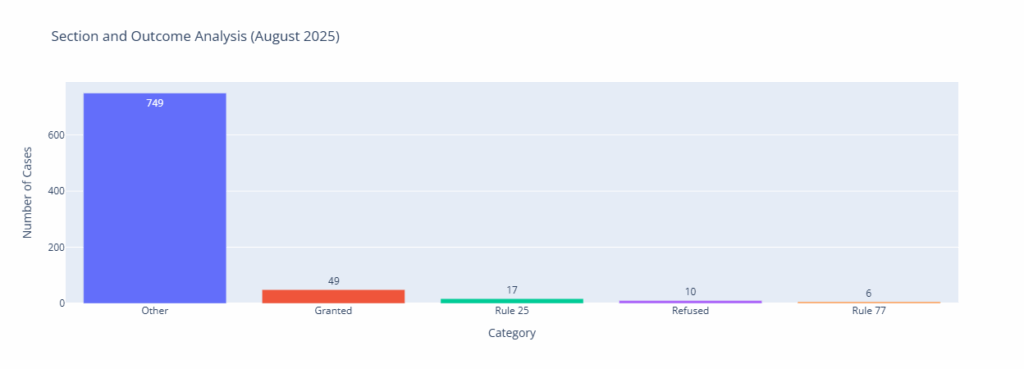
3. Section Category Summary:
Other: 749 cases (90.1%) – This is the Section 15/43 cases where there is no information given.
Granted: 49 cases (5.9%) | Section 25 (pre/post grant): 17 cases (2.0%) | Refused: 10 cases (1.2%) | Rule 77: 6 cases (0.7%)
4. Outcome Summary (Granted/Refused where explicitly stated):
Granted: 49 cases (5.9%) | Refused: 10 cases (1.2%) | Rule 25: 17 cases (2.0%) | Rule 77: 6 cases (0.7%)
Other/No Explicit Outcome: 749 cases (90.1%)
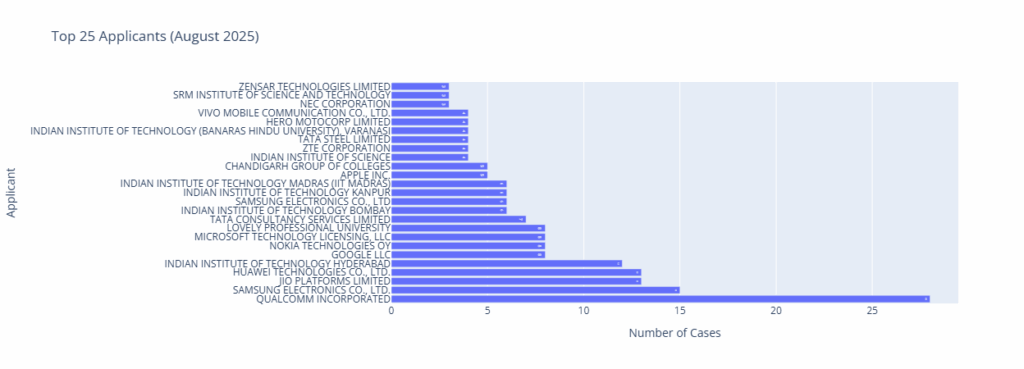
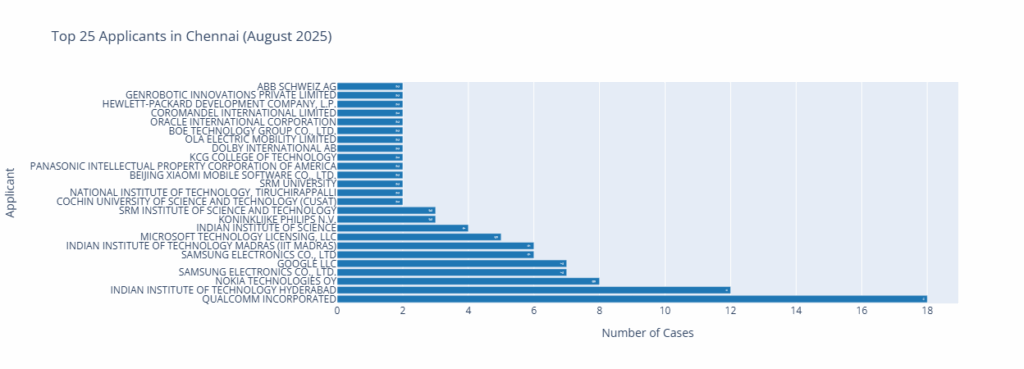
5. Top 5 Applicants:
QUALCOMM INCORPORATED: 28 cases | SAMSUNG ELECTRONICS CO., LTD.: 15 cases |
JIO PLATFORMS LIMITED: 13 cases | HUAWEI TECHNOLOGIES CO., LTD.: 13 cases | INDIAN INSTITUTE OF TECHNOLOGY HYDERABAD: 12 cases
6. Application Types by Jurisdiction:
Chennai: Convention: 6 cases; NP: 1 cases; Ordinary: 164 cases; PCT NP: 100 cases; PCT NP Divisional: 7 cases
Delhi: Convention: 11 cases; Convention Divisional: 2 cases; NP: 4 cases; Ordinary: 140 cases; PCT NP: 128 cases; PCT NP Divisional: 6 cases
Kolkata: Convention: 1 cases; NP: 2 cases; Ordinary: 42 cases; Ordinary Divisional: 2 cases; PCT NP: 22 cases; PCT NP Divisional: 1 cases
Mumbai: Convention: 2 cases; NP: 1 cases; Ordinary: 139 cases; Ordinary Divisional: 1 cases; Ordinary Patent of Addition: 1 cases; PCT NP: 45 cases; PCT NP Divisional: 3 cases
7. Filed Year Distribution:
2007: 3 cases (0.4%) | 2008: 1 cases (0.1%) | 2009: 2 cases (0.2%) | 2011: 4 cases (0.5%) | 2012: 1 cases (0.1%)
2013: 1 cases (0.1%) | 2014: 6 cases (0.7%) | 2015: 3 cases (0.4%) | 2016: 18 cases (2.2%) | 2017: 20 cases (2.4%)
2018: 48 cases (5.8%) | 2019: 74 cases (8.9%) | 2020: 92 cases (11.1%) | 2021: 150 cases (18.1%) | 2022: 170 cases (20.5%)
2023: 133 cases (16.0%) | 2024: 92 cases (11.1%) | 2025: 13 cases (1.6%)
=======================================