Patent Office in Numbers 2024-25

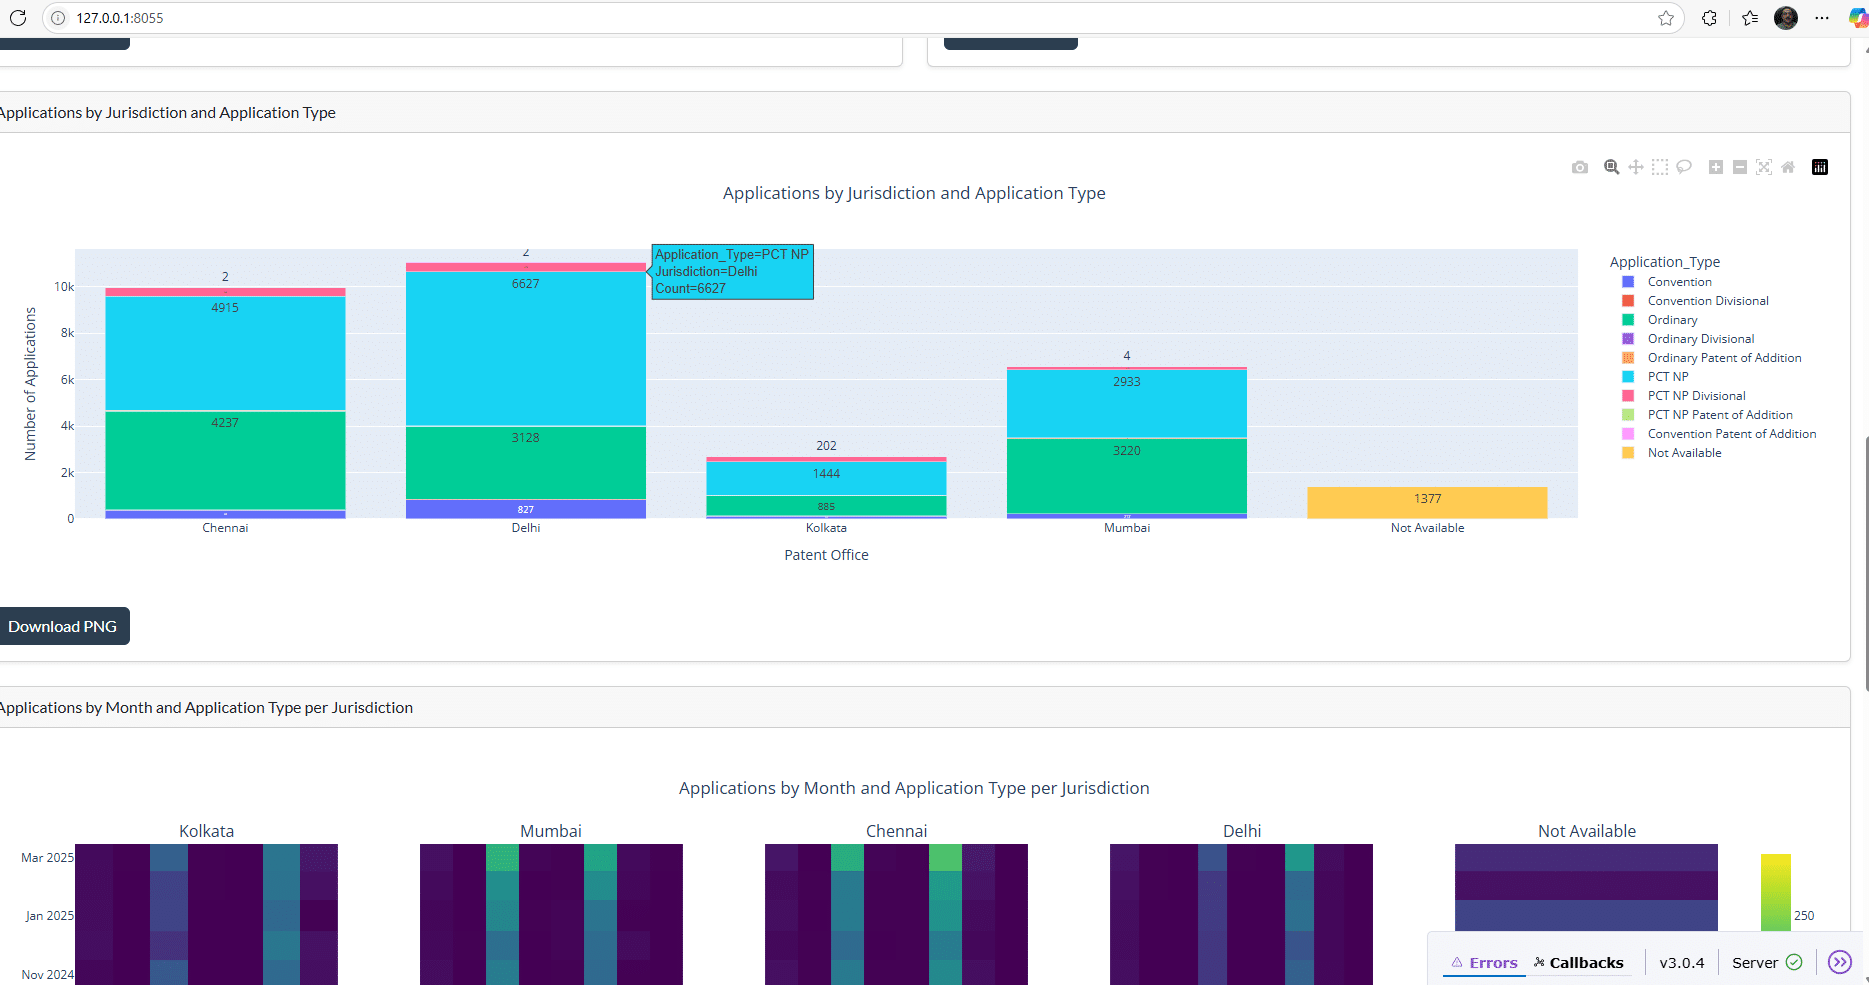
Our patent office examined about 31400 patent applications between April 1 2024 and March 31, 2025 at the four patent offices, viz. Delhi, Mumbai, Chennai and Kolkata. This post analyzes the decision data at a top level using just the decision dates feature. The Indian Financiall Year is from April – March | Python & Dash used to extract data and create these charts.

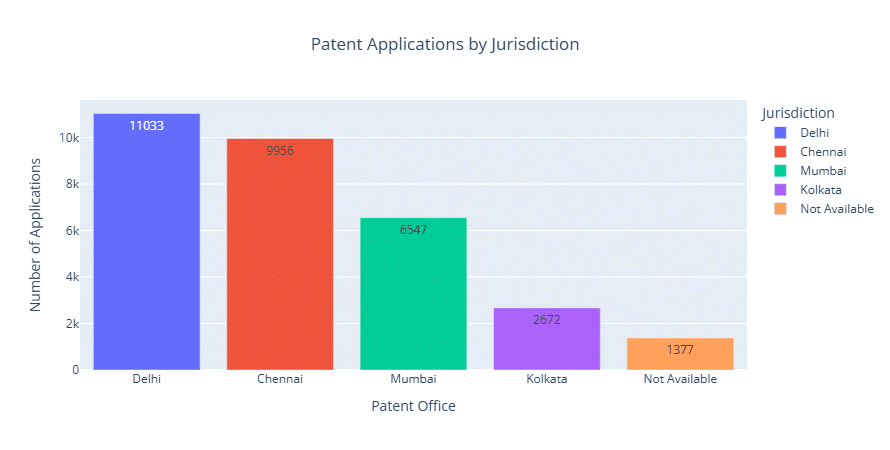
Number of Patent Applications:

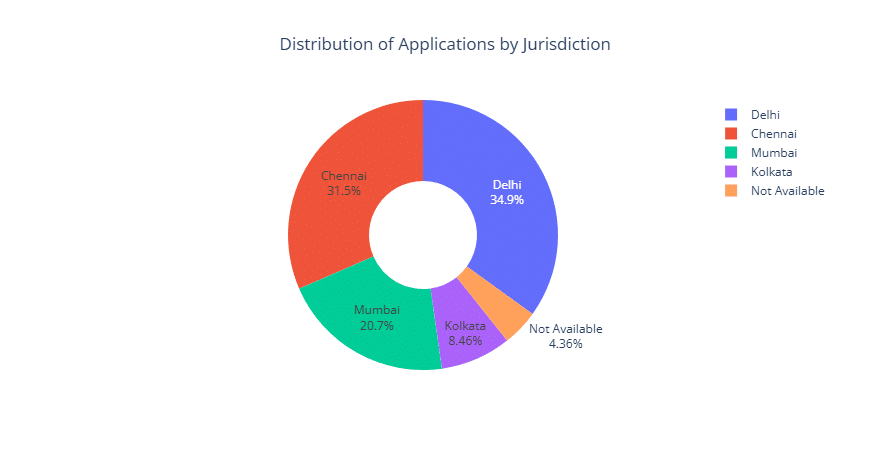
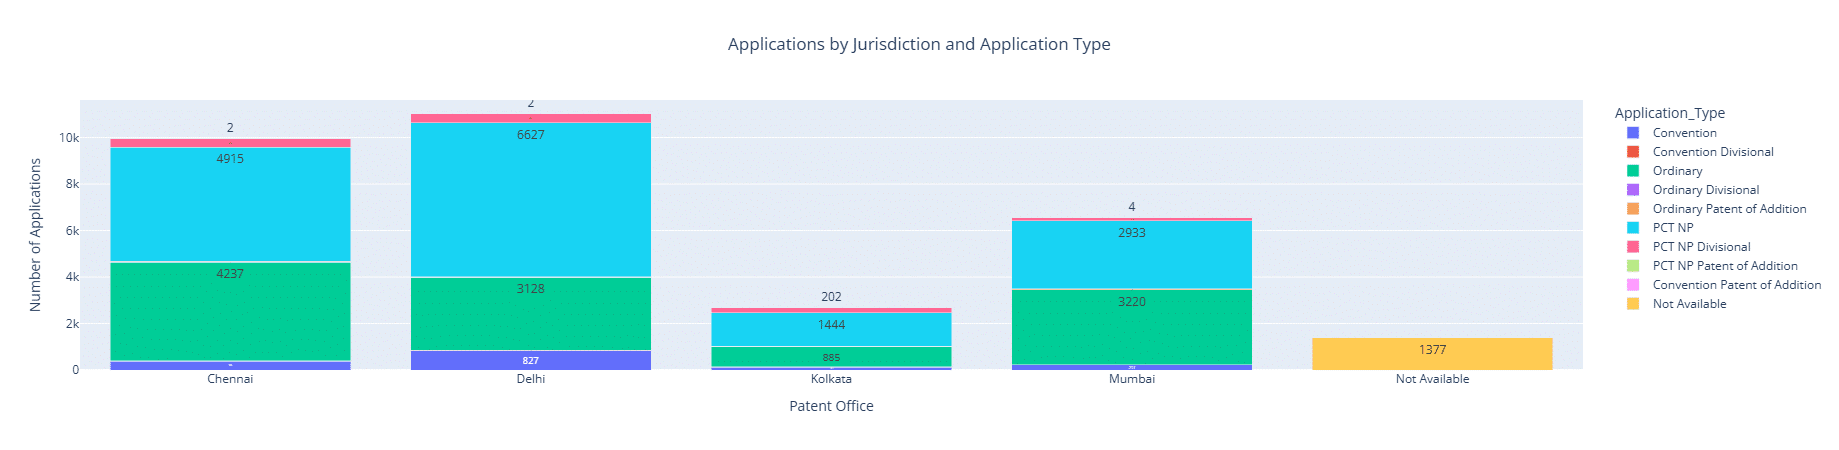
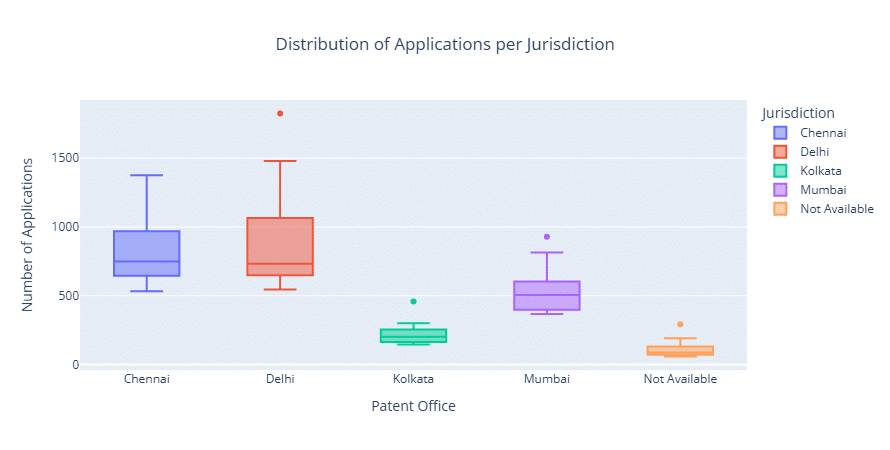
In the data analyzed, there were applications that were filed in the earlier numbering scheme, (for example, XXXXX/DEL/2007), were The ones that are labled ‘Not Available’ are of the old numbering type. Total data is of 31463 distinct applications examined.

Top Patent Applicants:

Of the total patent applications, an overall analysis was done about the top 25 Applicants in India.  It should come as no suprise that 23 out of 25 Applicants are not Indian entities.   

The top 25 Applicants across all jurisdictions are: Top 25 Applicants (Overall): 

File could not be opened. Check the file's permissions to make sure it's readable by your server.

Filings | Type

Bulk of the filings are still National Phase patent applications

Patent office work

More number of examiners and controllers at Delhi and Chennai patent offices.

Grants / Rejections

Not exactly clear about number of rejections or acceptance. But keywords used, provide some guidance.

Types of Patent Applications examined at each patent office

Follows from the applications filed (inference based on filings): PCT NP have the largest share followed by the Ordinary applications (Indian applicants).

Examination | Office

Distribution of examination load

Patent office work

There are more number of examiners and controllers at Delhi and Chennai patent offices.

Monthly Data of examinations at each patent office

Follows from the applications filed (inference based on filings): PCT NP have the largest share followed by the Ordinary applications (Indian applicants).

Distribution of applications per month

Cumulative monthly chart of disposals across all four patent offices.

Grant | Refusal | Section 25 | Not specified

Follows from the applications filed (inference based on filings): PCT NP have the largest share followed by the Ordinary applications (Indian applicants). The chart shows that mention of grant / refusal is usually not specified: only mentioned in 1.9%. There were only 10 pre or post grant petitions that were disposed off in this period. Section 64 petitions were not explicitly mentioned in the data set.

Snapshot of the data

Data was extracted, then cleaned, sorted and categorized using python. Grant / refusal data is not explicit.

Created with Python