

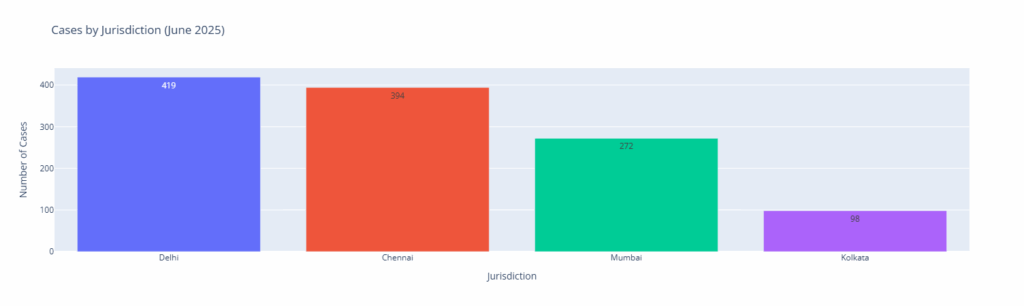
Applications sorted according to jurisdiction: As shown in the chart (above) itself, this is a histogram of the total number of application examined in each jurisdiction during the month of June 2025. A total of 1226 application data was obtained from the IP India website. Thereafter, duplicates were discarded and data analysed.
Total Applications by Jurisdiction: Jurisdiction
Delhi 419
Chennai 394
Mumbai 272
Kolkata 98
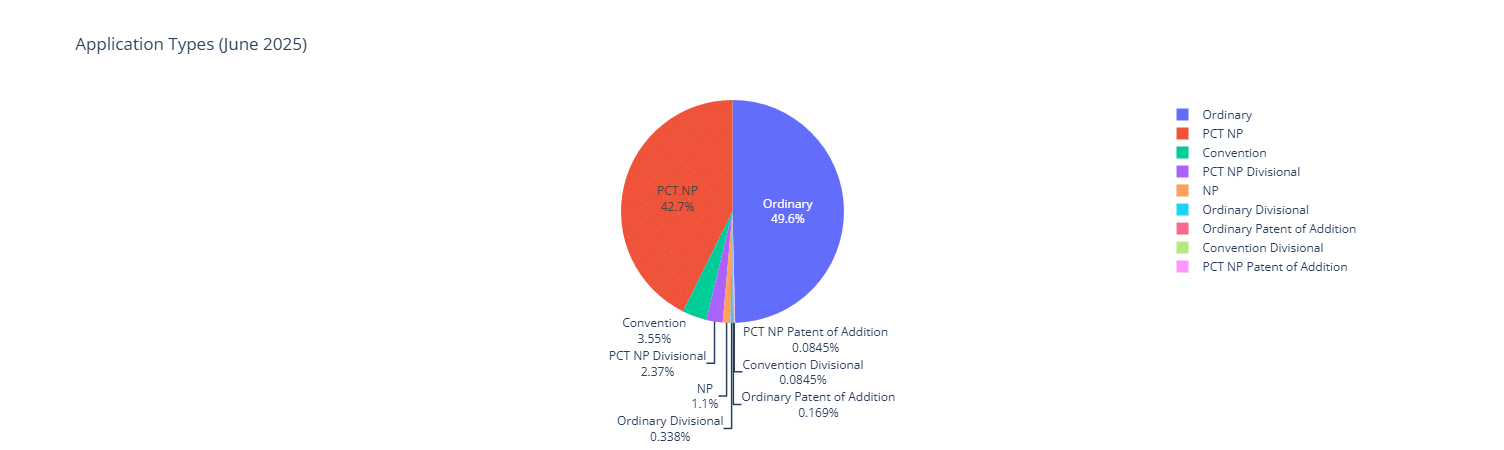
The above pie chart shows the types of applications that were considered. The position was very similar last month.
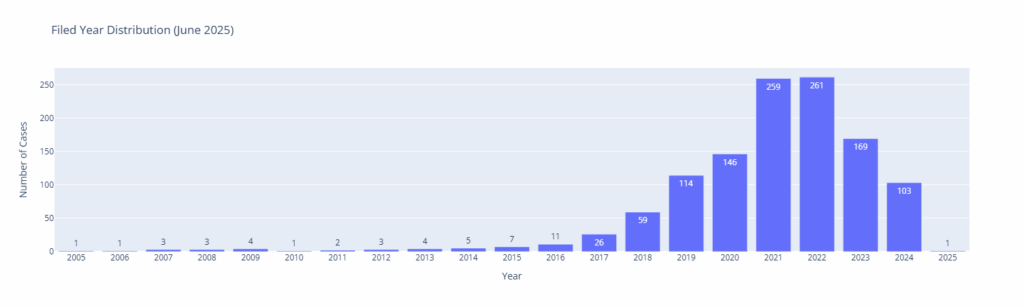
The above chart shows the year in which the applications that were taken up in June 2025 for examination / controller decision, were filed. Majority of the filing is of 2021. However, there are cases pending from 2006 onwards.
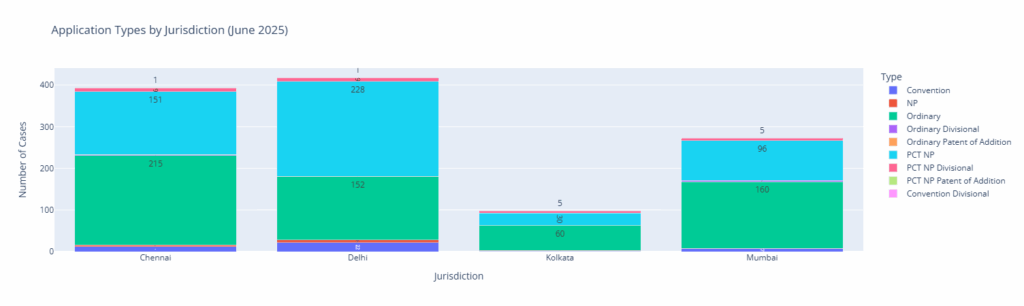
The above chart shows the distribution of types of application across jurisdictions.
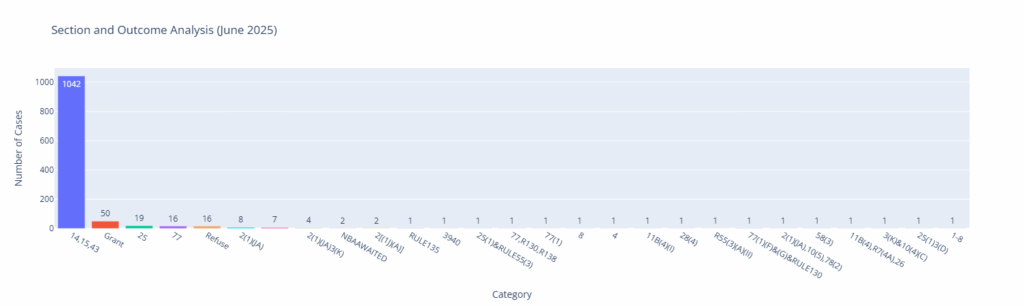
The above image shows the distribution of sections under which the application was considered or a section / rule applied to the application when being examined. To create this chart, I did some level of manual cleaning / sorting of data. Unlike last time, wherever 15, 43, or any combination thereof was there, was marked as 14, 15, 43. This classification reflects that for these applications, only this was the available data.
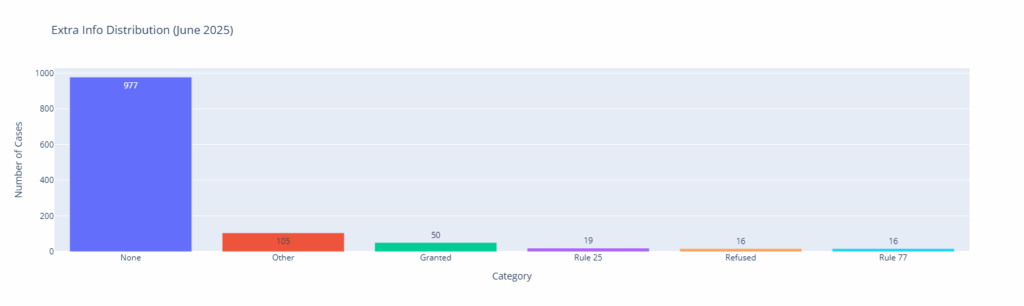
The real value of the above chart is the other data of Grant / refusal / number of pre-grant or post grant oppositions filed; decisions where review of controller’s decision was issued, etc. We can see that out of the 230 odd applications where there is some indication as to what transpired, there are 50 Grants , 19 cases where either a pre-grant or post-grant data is there, etc.
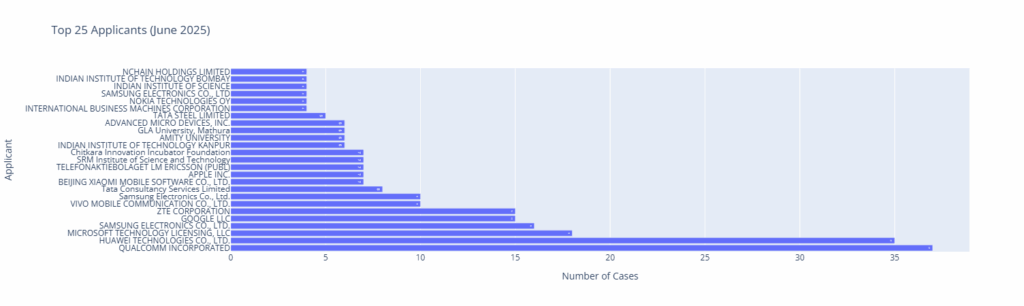
The Top 25 Applicants in whose cases decisions were issued in May are indicated in the above chart.